
If you have ever looked closely at the Disparity Analysis section in your AAP, you will see numbers concerning standard deviations that are assigned to selection rates of applicants, promotions, and terminations, but what do these standard deviation numbers actually mean?
Simply put – a standard deviation is a statistic that measures the variation (how far away) of a set of values when compared to the average. Low standard deviation means that the individual data points are clustered close together around the average, while a high standard deviation tells us that the data points are spread out above/below the average.
How does this work in my disparity analysis?
The Disparity Analysis compares selection rates of gender and race groups for hires, promotions, and terminations, and determines which of those groups is farthest away from the others by assigning that group with the largest Standard Deviation. In affirmative action plans, any group that shows a selection rate with two standard deviations (technically 1.96 but we can round up) or more will result in a flag for risk of disparity. To understand why we choose two as the magic number to flag disparity, we first need to equate our standard deviation number to a probability or percentage of the selection rates occurring by random chance (assuming what we are testing follows a normal distribution – which it does). Lucky for us, we have the Empirical Rule to help us out which tells us that around 68% of the time we should expect to be within one standard deviation away from the average, around 95% of the time we expect to be within two standard deviations, and 99.7% of the time within three standard deviations. (http://www.stat.yale.edu/Courses/1997-98/101/normal.htm)
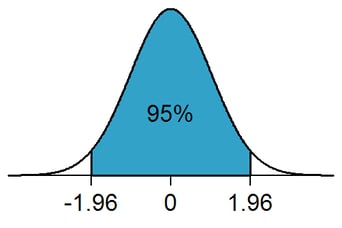
So the next time you are flipping through your Disparity Analysis, double-check the standard deviation numbers – anything greater than 2 (or 1.96 if we are being exact) signals that there was a less than 5% chance of that race or gender group’s selection rate happening at random!
If you would like more information about Affirmative Action Plans or Pay Equity Analysis, please contact OutSolve at info@outsolve.com or 888-414-2410.


Former DOL Officials Issue Open Letter to Federal Contractors
On April 15, 2025, ten former senior officials from the U.S. Department of Labor (DOL), including past leaders of the Office of Federal Contract...
The Ultimate Guide to Multi-State Labor Law Posters
Human Resources professionals understand how important and challenging it can be to remain updated and compliant with labor laws. This is especially...

Countdown: Final Days of the 90-Day Safe Harbor Period for AAPs
April is here and with that comes the end of the 90-day safe harbor period for federal contractors complying with EO 11246. As April 21, 2025,...